In my previous post, I described how to create a composite true colour Landsat-8 image in ArcGIS for use as a base map. The resulting colour image had the same resolution as the three bands (red, green and blue) combined to create it. Landsat-8 visible light (red, green and blue) bands, near infra-red (NIR), and short-wave infra-red (SWIR) bands are 30m resolution. Thermal infra-red (TIR) bands are 100m resolution. The Landsat-8 also offers a higher resolution band – the panchromatic band (8), with a 15m resolution, which we can use to improve the resolution of our composite image through a process called ‘pan-sharpening’.
Lacking resolution
The resolution of a satellite image is crucial since it determines the pixel size and therefore how large a feature must be to be visible in the satellite imagery. The pixels of the 30m resolution true colour composite that I made in the previous post represent 30m in real life. Consequently, the composite image will not show anything less than 30m in size, while things only slightly larger than 30m are indistinct. When zooming in, the true colour image starts to pixellate at a scale of around 1:30,000m and is too pixellated to be useful by about 1:10,000m. This limits its use to smaller-scale maps with limited detail. The 15m resolution panchromatic band is much more suitable for larger scale maps, showing smaller features and remaining coherent at 1:10,000m.


Pan-sharpening
Pan-sharpening fuses the composite colour image with the panchromatic band to create a new true colour image with the resolution of the panchromatic band. There are three ways of pan-sharpening an image in ArcGIS: in the Symbology tab of the layer’s properties; in the Image Analysis Window; or with the ‘Create Pansharpened Raster Dataset‘ tool. Whichever way you access pansharpening, you will need to choose a pan-sharpening method from those detailed here. If you are using a common satellite sensor, such as Landsat-8, choosing the Gram-Schmidt method and then selecting the correct satellite under ‘Sensor’ causes ArcGIS to use the correct band weighting for that satellite. If you use the symbology table or the Image Analysis Window to pan-sharpen you will need to export your newly pan-sharpened image as a new layer as the final step. The ‘Create Pansharpenend Raster Dataset’ tool of the Data Managament>Raster>Raster Processing toolset creates a new raster as it pan-sharpens. For a video of me pan-sharpening the composite 3-band 4-3-2 RGB true colour Landsat-8 image using the ‘Create Pansharpenend Raster Dataset’ please see my video below or on my Youtube channel.

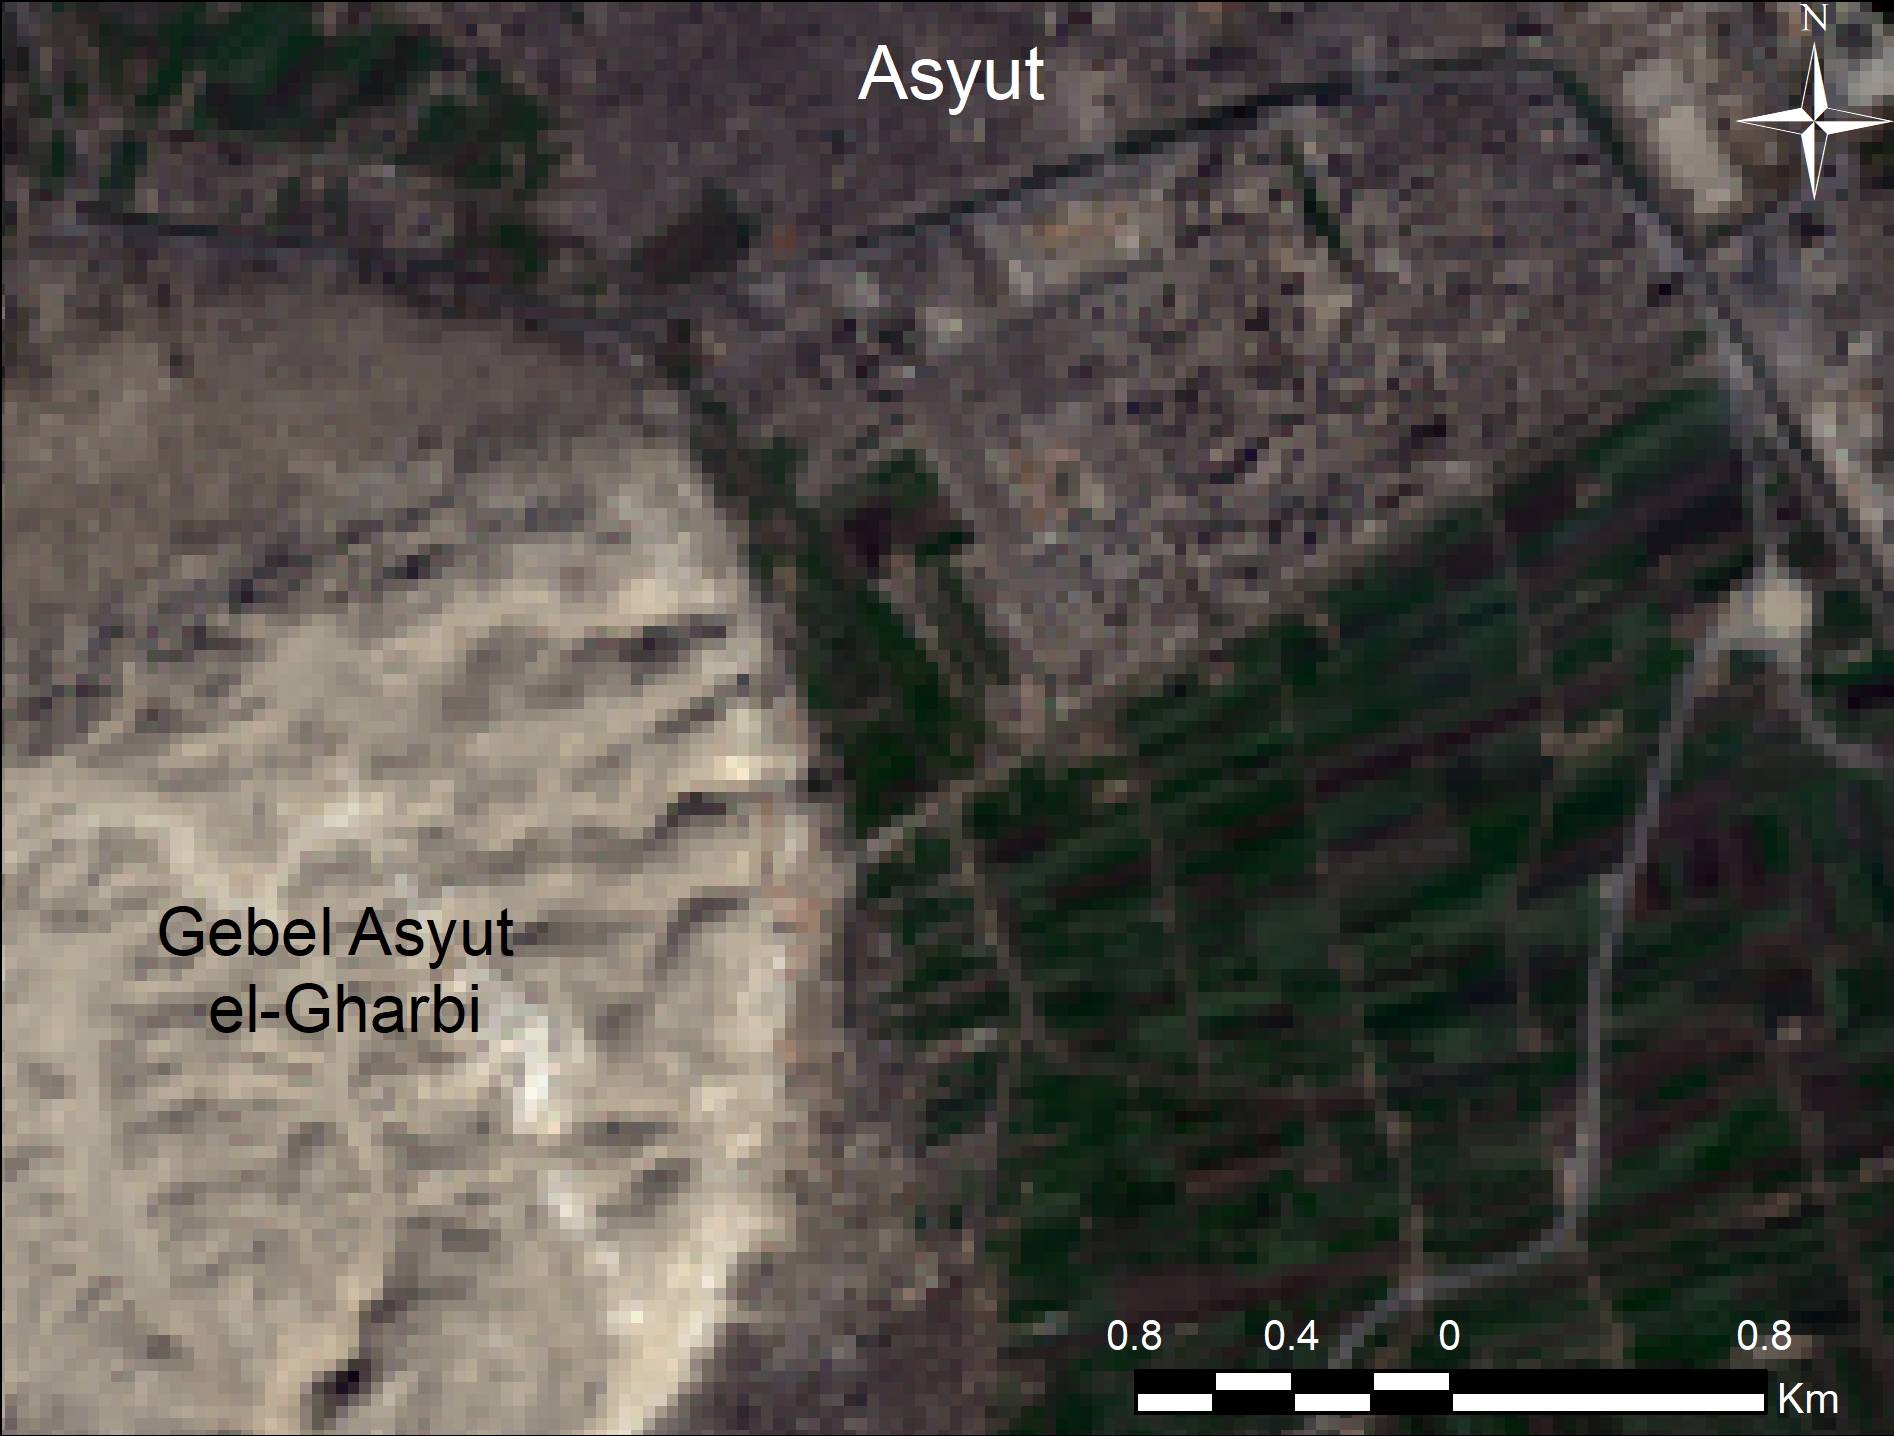
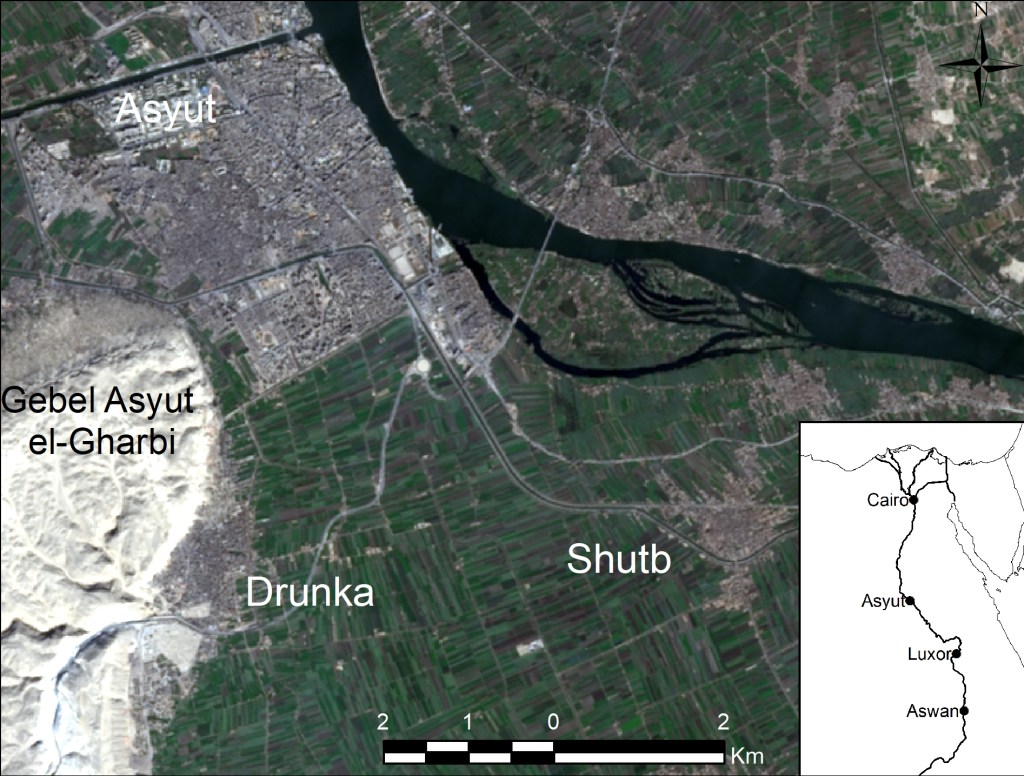
The resulting pan-sharpened image (above) combines the true colours of the Landsat-8 red, green and blue spectral bands with the higher resolution of the panchromatic band, producing an attractive and better resolution basemap for subsequent work. At a large scale it is clear that the pan-sharpened image is clearer and crisper than the original composite (below).


Acknowledgements
All the images in this blog post were created using ArcGIS® software by Esri. ArcGIS® and ArcMap™ are the intellectual property of Esri and are used herein under license. Copyright © Esri. All rights reserved. For more information about Esri® software, please visit http://www.esri.com.
The satellite imagery used is Landsat 8 data from the United States Geological Survey.
Find out more
Related posts
-

Five years on: Reflections on mobile GIS survey at Hatnub Quarry P in 2017
-

Fuel shortages, Google Maps and adapting your tools
-

Free high-resolution satellite imagery and how to find it.

Good morning Hannah,
I took your GIS course for Egyptologists two years ago, my name is Giulia Nicatore, phd at Paris 1 in Geoarchaeology and Demotic. Thank you for these posts, they are very useful and very clear. I have a question about Landsats in output to pan-sharpening treatment. Once the treatment is done (in my case I do it on QGis 3.22), is it possible to “extract” a DEM from this image? My PhD is centred on the western floodplain at Luxor and a reconstruction of the morpho-alluvial units in the sector. I have at my disposal various remote sensing images but few high-resolution DEMs available for free (as you point out, on the USGS site). I have at my disposal Pleaides images (1 m resolution but limited coverage and AsterGDEM v.3 with 30 m resolution). Hence my question…a 15m resolution DEM would be excellent for my work ! alternatively, if you know of a high resolution DEM or MNT available for free I am interested !
Sincerely,
Giulia
Dear Giulia
Thank you for your comment. I’m glad you found the GIS course and these posts useful. Unfortunately its not possible to extract a DEM from the Landsat images as used because you need a stereo-pair satellite image to create a DEM. The best free resolution DEMs are the ASTER GDEM (https://www.earthdata.nasa.gov/news/new-aster-gdem) and the SRTM v2 (https://www2.jpl.nasa.gov/srtm/) but both are at 30m as I’m sure you already know. If you want to create a DEM you may need to create your own. CORONA satellite photography (roughly 2m resolution) from the KH-4 missions may be your best bet, but you will need to find the stereo pair and create the DEM yourself. I suggest you review the CORONA atlas of the Middle East (https://corona.cast.uark.edu/atlas) to locate suitable images. I’d love to help, but I’ve not used CORONA for this previously myself. Alternatively if you are able to find some funding, you can purchase a DEM from high resolution satellite imagery such as Worldview 2-4.
Good luck in your research.
I’ve received a reader question on pan-sharpening composite satellite imagery. The reader asks ‘Could you give me your opinion on pan-sharpening a composite Landsat-8 image which contains the NIR (near-infrared) band. Would this process be accurate for the NIR band, since the Panchromatic image does not overlap with the NIR band?’ The short answer to this is it should be perfectly possible to pan-sharpen a composite containing the NIR. It doesn’t matter if the panchromatic image overlaps with the NIR band in terms of electromagnetic wavelength, but it DOES need to overlap with it spatially. You should use the panchromatic band from the same Landsat-8 dataset as the other bands in the composite image. This video explains it visually https://youtu.be/45ChF0BdwLQ